De sector in cijfers
Vlaanderen
-
Totaal aantal operationele windturbines in Vlaanderen op 31/12/2025: 722 turbines = 1929 MW.
-
13 nieuwe windturbines in 2025 = 50 MW.
geïnstalleerd vermogen in Vlaanderen
elektriciteit in België afkomstig van wind (in 2024)
windturbines in Vlaanderen
gezinnen voorzien van stroom door Belgische windturbines
https://www.elia.be/nl/pers/2025/01/20250102_electricity-mix#:~:text=Tendensen%202024,%2C2%25%20in%202023).
België
Wind is een belangrijk onderdeel in de Belgische energiemix.
-
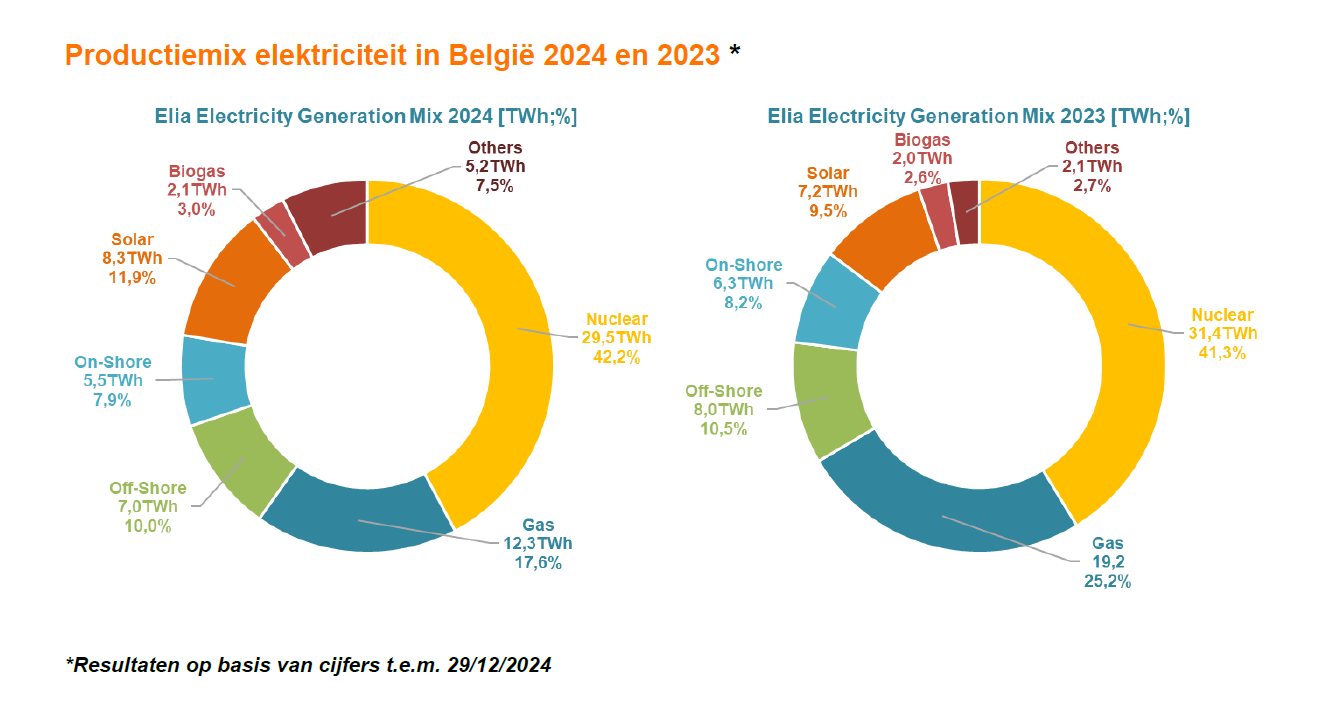
De totale windenergieproductie in België in 2024 bedroeg: 12,5 TWh. Dat is 18% van de totale elektriciteitsvraag in België.
-
In België werd in 2024 bijna 70 TWh elektriciteit geproduceerd. 20,8 procent daarvan was hernieuwbare energie. Windenergie maakt 18,7% uit van de elektriciteitsmix.
-
Hernieuwbare energie zorgt voor een steeds groter aandeel in de totale Belgische elektriciteitsproductie. In 2024 zorgden hernieuwbare energiebronnen meer dan 11% van de tijd voor de helft van het Belgische verbruik.
- België https://vwea.be/wp-content/uploads/2024/05/belgie.json
- Bulgarije https://vwea.be/wp-content/uploads/2024/05/bulgarije.json
- Cyprus https://vwea.be/wp-content/uploads/2024/05/cyprus.json
- Denemarken https://vwea.be/wp-content/uploads/2024/05/denemarken.json
- Duitsland https://vwea.be/wp-content/uploads/2024/05/duitsland.json
- Estland https://vwea.be/wp-content/uploads/2024/05/estland.json
- Finland https://vwea.be/wp-content/uploads/2024/05/finland.json
- Frankrijk https://vwea.be/wp-content/uploads/2024/05/frankrijk.json
- Griekenland https://vwea.be/wp-content/uploads/2024/05/griekenland.json
- Hongarije https://vwea.be/wp-content/uploads/2024/05/hongarije.json
- Ierland https://vwea.be/wp-content/uploads/2024/05/ierland.json
- IJsland https://vwea.be/wp-content/uploads/2024/05/ijsland.json
- Italië https://vwea.be/wp-content/uploads/2024/05/italie.json
- Kroatië https://vwea.be/wp-content/uploads/2024/05/kroatie.json
- Letland https://vwea.be/wp-content/uploads/2024/05/letland.json
- Litouwen https://vwea.be/wp-content/uploads/2024/05/litouwen.json
- Luxemburg https://vwea.be/wp-content/uploads/2024/05/luxemburg.json
- Nederland https://vwea.be/wp-content/uploads/2024/05/nederland.json
- Noorwegen https://vwea.be/wp-content/uploads/2024/05/noorwegen.json
- Oostenrijk https://vwea.be/wp-content/uploads/2024/05/oostenrijk.json
- Polen https://vwea.be/wp-content/uploads/2024/05/polen.json
- Portugal https://vwea.be/wp-content/uploads/2024/05/portugal.json
- Roemenië https://vwea.be/wp-content/uploads/2024/05/roemenie.json
- Slovenië https://vwea.be/wp-content/uploads/2024/05/slovenie.json
- Slowakije https://vwea.be/wp-content/uploads/2024/05/slowakije.json
- Spanje https://vwea.be/wp-content/uploads/2024/05/spanje.json
- Tsjechië https://vwea.be/wp-content/uploads/2024/05/tsjechie.json
- Zweden https://vwea.be/wp-content/uploads/2024/05/zweden.json
- Zwitserland https://vwea.be/wp-content/uploads/2024/05/zwitserland.json
- Vlaanderen https://vwea.be/wp-content/uploads/2024/05/flanders-1.json
- Noordzee https://vwea.be/wp-content/uploads/2024/05/map-1.geojson
- Wallonië https://vwea.be/wp-content/uploads/2024/05/waloonns-1.json
- Oost-Vlaanderen https://vwea.be/wp-content/uploads/2024/05/oostvlaanderen.geojson
- West-Vlaanderen https://vwea.be/wp-content/uploads/2024/05/westvlaanderen.geojson
- Antwerpen https://vwea.be/wp-content/uploads/2024/05/antwerpen.geojson
- Limburg https://vwea.be/wp-content/uploads/2024/05/limburg.geojson
- Vlaams-Brabant https://vwea.be/wp-content/uploads/2024/05/vlaamsbrabant.geojson